


Tuesday, 22/09/2026, 11:02 (GMT +7)
 21
21
International Shipping and Logistics Market Update Week 38/2026 | Phaata

International shipping and logistics market update - Week 38/2026
Table of Contents
-
World Container Index Week 38/2026
-
Asia - North America Ocean Freight Rates
-
Asia - Europe Ocean Freight Rates
-
Northern America - Asia Ocean Freight Rates
-
Northern Europe - Asia Ocean Freight Rates
-
Conclusions and Recommendations by Phaata
1. World Container Index Week 38/2026
Drewry’s World Container Index (WCI) for Week 38/2026 (from September 14 to September 20, 2026) edged up by 0.25% compared to the previous week, settling at $4,500/FEU.
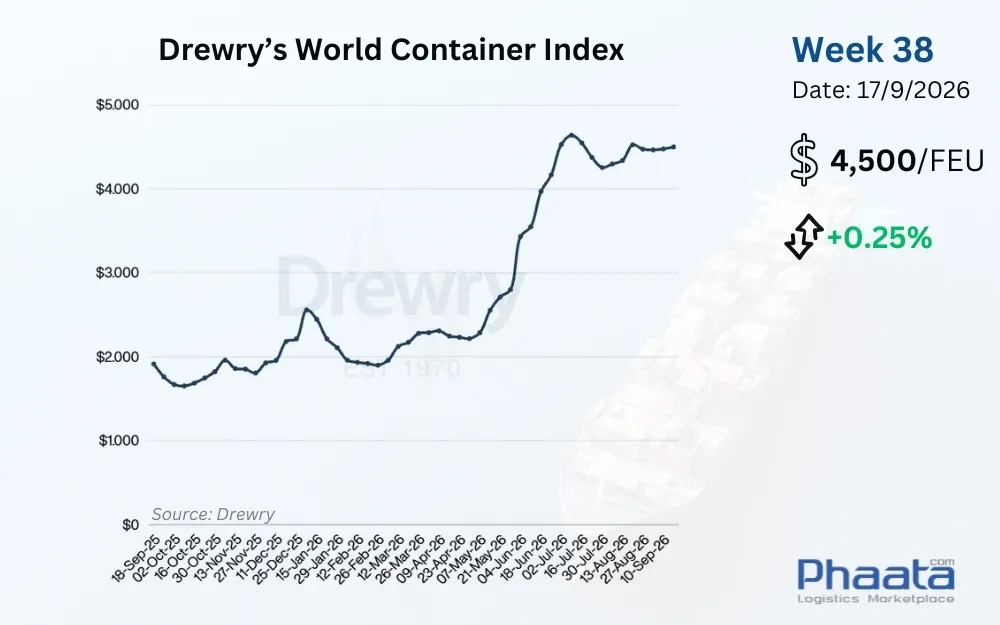
Drewry's World Container Index Week 38/2026 (Photo: Phaata)
2. Asia-North America Ocean Freight Rates
Supply and Demand:
Extended Peak Season & Sustained High Volumes: Contrary to earlier forecasts predicting a cooldown, the peak season is stretching longer than anticipated, with carriers maintaining operations at near 100% of design capacity. September is projected to be the highest import month of the year at U.S. gateways, with total volumes estimated at 2.31 million TEUs, a 9.6% year-over-year (YoY) increase. Actual data confirms that throughput at West Coast port complexes remains elevated: The Port of Los Angeles handled 955,907 TEUs in August - 6% above its 5-year average - capping off the three highest-volume months in its history. Meanwhile, the Port of Long Beach recorded roughly 920,000 TEUs in August, a 2% YoY increase.
Seasonal Capacity Reductions: Despite high September demand, carriers have scheduled capacity adjustments starting the week of September 28, with steeper cuts planned for October. The capacity reduction rate is projected to hit approximately 18% by the week of October 12. This maneuver is primarily designed to align supply with the impending factory closures during China's Golden Week and the anticipated seasonal cooling of demand. U.S. import volumes in October are forecast at roughly 2.11 million TEUs, down 1.7% YoY. Consequently, these current capacity adjustments are viewed as seasonal supply regulation rather than an indicator of a market-wide space shortage.
Origin Port Disruptions: Congestion at several Chinese ports continues to constrict actual capacity supply, as vessel turnaround times and operational schedules take a hit from loading port disruptions.
Rate Developments:
Ocean freight rates from Asia to the North America West Coast in Week 38/2026 increased by 3.5% week-on-week, reaching $8,033/FEU. This rate is up 11.85% month-on-month, according to Xeneta data.
Spot Rates Sustain Upward Trend: The rate baseline continues to climb across both corridors. Spot rates to the U.S. East Coast (USEC) rose 8.55% week-on-week (WoW), while rates to the U.S. West Coast (USWC) increased by 3.53%. Major market benchmark indices reflect a relatively uniform upward trajectory across both coasts.
Panama Canal Drives Rate Discrepancies: Rate hikes on the East Coast continue to outpace the West Coast. This divergence partially reflects the impact of ongoing draft restrictions caused by low water levels at the Panama Canal, which degrades the operational capacity of all-water routings bound for the USEC.
Stay tuned to Phaata International Logistics Marketplace for in-depth and fast market updates.
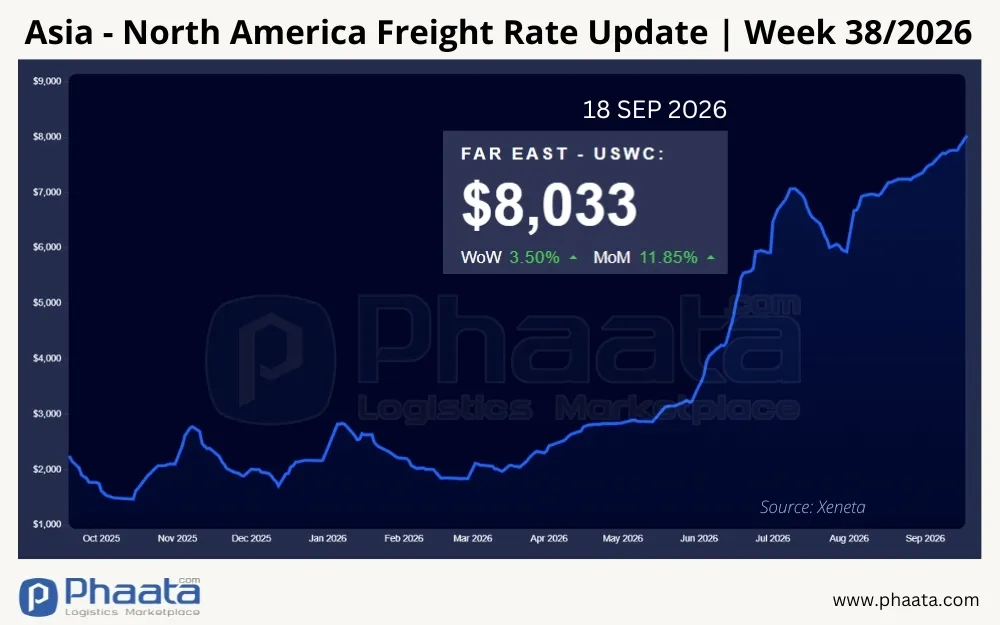
Asia-North America Freight Rates | Week 38/2026 (Photo: Phaata.com)
US Tariff Updates:
1. Russian Sanctions Bill: Potential for 100% Secondary Tariffs on Select Nations
Legislative Progress: The U.S. House of Representatives passed a bill regarding Russian sanctions by a vote of 262-159. Under the bill, the executive branch is authorized to impose secondary tariffs of up to 100% on goods from up to 15 countries. This includes nations importing large volumes of Russian oil and gas, as well as countries cited in the bill for their trade activities with Russia. The bill also proposes tariffs of up to 500% on specific Russian-origin products. Further implementation steps are expected to be reviewed within 30 days.
Targeted Country Groups:
-
Energy Group: The list encompasses nations actively importing Russian oil and gas.
-
“Shadow Fleet” Affiliates: Various international tracking data and documents, including sources from the European Parliament, highlight certain flag states with vessels identified as belonging to, or associated with, the so-called "shadow fleet." This information may be heavily weighed as authorities monitor developments in international trade and maritime transport.
2. CAPE System Legal Update: Phase 3 Slated for October 6 Launch
Phase 3 Deployment Milestone: According to court filings, U.S. Customs and Border Protection (CBP) expects to launch Phase 3 of the Centralized Account Processing and Management Environment (CAPE) on October 6. This phase involves processing finally liquidated entries for plaintiffs who secured court-ordered reliquidation rulings.
Filing Eligibility: Businesses that provided a valid Importer of Record (IOR) number to CBP before the July 30 deadline are expected to be able to file via CAPE when the system opens on October 6. For entities that submitted their IORs after this deadline, CBP plans to issue separate guidance on the processing workflow.
Stay tuned to articles on the Phaata International Logistics Marketplace for rapid and in-depth market updates.
3. Asia-Europe Ocean Freight Rates
Supply and Demand:
Capacity Adjustments Ahead of Golden Week: Throughout September, carriers have maintained operations near 100% of design capacity. However, supply adjustment plans are slated to roll out starting mid-October, with the blank sailing ratio potentially hitting 20% the week of October 12, and remaining at roughly 17% the following week. This move is primarily intended to recalibrate supply during a period of expected demand contraction due to Golden Week, thereby supporting the rate baseline, rather than reflecting a genuine lack of market space.
Suez Canal Rerouting: Capacity supply is gradually shifting back to the Suez Canal routing. The Gemini Cooperation (Maersk and Hapag-Lloyd) plans to transition an additional 4 services from the Cape of Good Hope back to the Suez, with rollout dates set for September 19, 21, and 24. Alongside 2 existing services, these loops cover several Asia - North Europe, Asia - Mediterranean, and India - Europe corridors. It is estimated that over 25% of total Asia-Europe capacity could be routed via the Red Sea in September.
Corridor Divergence and Geopolitical Risks: This transition is occurring much faster on the Asia-Mediterranean route, where roughly 35% of westbound capacity is projected to utilize the Suez, compared to only about 6% for North Europe. Nonetheless, maintaining these routings hinges heavily on regional security developments. Incidents in the Bab el-Mandeb Strait - the southern gateway to the Red Sea - remain a critical variable that carriers and shippers must monitor when evaluating routing options.
Freight Rate Developments:
Ocean freight rates from Asia to Europe in Week 38/2026 fell by 4.44% week-on-week, dropping to $3,956/FEU. This rate represents a 16.52% decrease month-on-month, according to Xeneta data.
Spot Rates Continue to Decline: The rate baseline is sustaining its downward correction. Specifically, Asia to North Europe spot rates dropped WoW. Key trade lanes such as Shanghai - Rotterdam and Shanghai - Genoa also recorded lower rate baselines.
Dual Pressure from Supply and Demand: The current downward trend is being driven simultaneously by post-peak demand cooling and the phased restoration of Suez Canal transits. Shorter transit times via the Suez are accelerating vessel turnarounds, effectively injecting actual operational capacity back into the market. However, because rates are still elevated compared to pre-peak levels, this correction is proceeding at a relatively measured pace.
Inland Logistics Bottlenecks: Congestion at several North European transshipment hubs remains unresolved, continuing to disrupt inland delivery schedules for various import cargo flows.
Stay tuned to Phaata International Logistics Marketplace for in-depth and fast market updates.
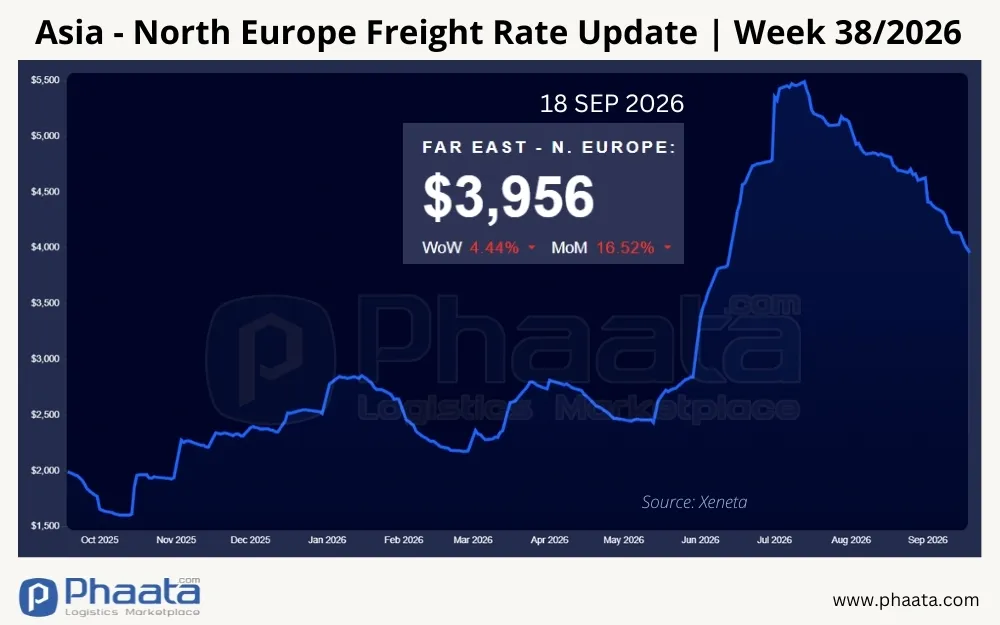
Asia-Europe Freight Rates | Week 38/2026 (Photo: Phaata.com)
4. North America - Asia Ocean Freight Rates
Ocean freight rates from North America (West Coast) to Asia in Week 38/2026 increased by 2.13% week-on-week, settling at $718/FEU. This rate is up 4.82% month-on-month, according to Xeneta data.
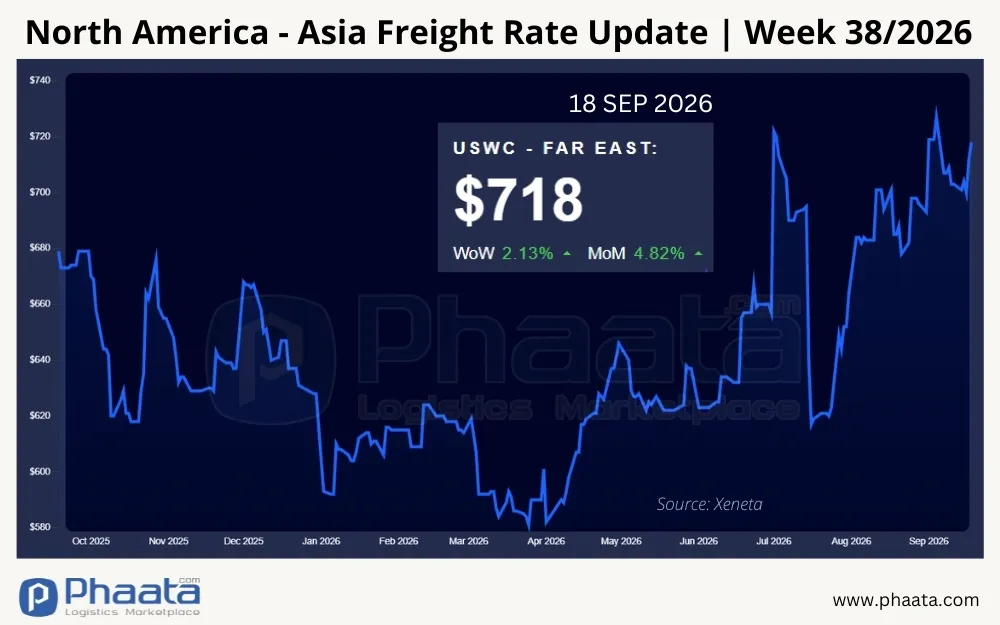
North America (West Coast) - Asia freight rates | Week 38/2026 (Photo: Phaata.com)
5. Northern Europe - Asia Ocean Freight Rates
Ocean freight rates from North Europe to Asia in Week 38/2026 increased by 0.85% week-on-week, reaching $238/FEU. This rate is down 8.11% month-on-month, per Xeneta data.
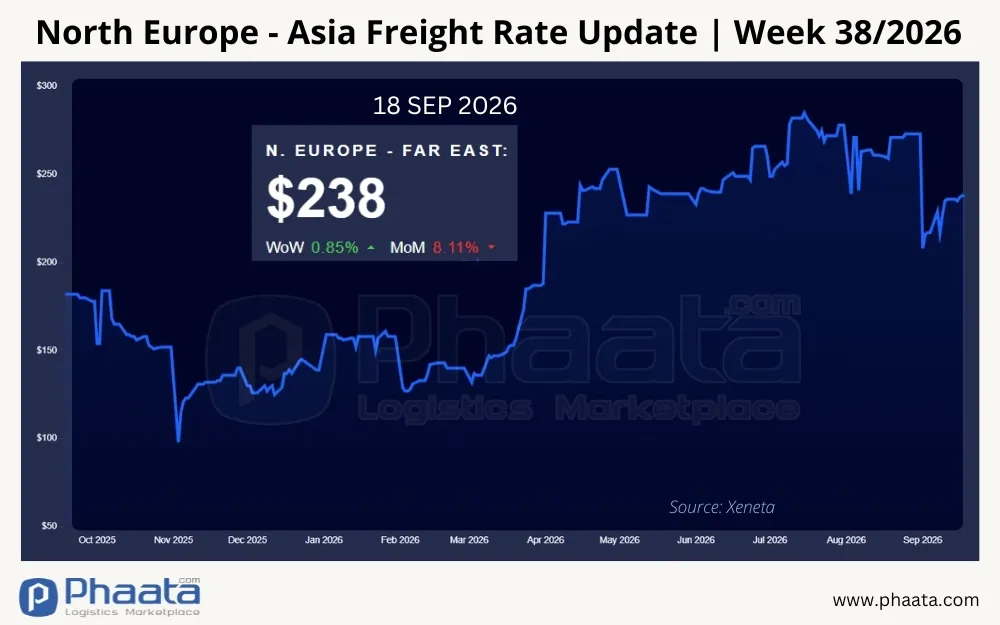
Container Freight rates from Northern Europe to Asia | Week 38/2026 (Photo: Phaata.com)
6. Conclusion and Recommendations from Phaata
The maritime transport market in Week 38/2026 continues to exhibit stark divergence across major trade lanes. While the composite WCI remained virtually flat at $4,500/FEU, rate trajectories and operational conditions varied significantly between the Asia - North America and Asia - Europe corridors:
Asia - North America Route: A longer-than-expected peak season continues to sustain U.S. import volumes at high levels. Congestion at select Chinese ports, coupled with draft restrictions at the Panama Canal, is compounding pressure on actual capacity supply and transit times. West Coast spot rates surged to $8,033/FEU. Meanwhile, carriers plan to slash roughly 18% of capacity in October, primarily to balance supply against anticipated post-Golden Week demand drops.
Asia - Europe Route: Spot rates dropped to $3,956/FEU as actual capacity supply improved. The Gemini Cooperation's phased reinstatement of 4 additional services via the Suez Canal is shortening vessel turnarounds and injecting capacity back into the market. Anticipating a demand slump after Golden Week, carriers plan to cut approximately 20% of capacity by the week of October 12 to balance supply and demand and help stabilize the rate baseline.
U.S. Trade Compliance Risks: The House-passed bill concerning Russian sanctions is drawing intense scrutiny from businesses with supply chains linked to the countries named within. Under the bill, the executive branch could impose tariffs of up to 100% on certain third-party nations. However, actual enforcement will depend on subsequent implementation steps. Meanwhile, Phase 3 of the CAPE system is slated for an October 6 launch, which should facilitate the refund processing for eligible entries.
Recommendations from Phaata
Proactive October Space Preparation: With carriers planning capacity adjustments post-Golden Week, businesses should consider booking early for October shipments and building appropriate time buffers into their cargo-ready dates. For highly time-sensitive shipments, preparing alternative transport plans can mitigate the impact should a roll-over occur.
Flexible Routing Strategies:
-
North American Corridor: For USEC-bound shipments, businesses should evaluate the Mini Land Bridge (MLB) option via West Coast ports, especially if operational constraints at the Panama Canal fail to meet time or cost requirements. This alternative should be benchmarked against all-water routings based on total transit time, cost, and inland connectivity.
-
European Corridor: Shippers should confirm the actual routing—Suez Canal vs. Cape of Good Hope—with carriers at the time of booking confirmation, providing a firmer basis for delivery planning. Monitoring container release capabilities at North European transshipment hubs will also assist businesses in planning container haulage and controlling demurrage costs.
Tariff Risk and Cash Flow Management:
-
Supply Chain Structural Audits: Importers sourcing raw materials from countries cited in the Russian sanctions bill must audit their product origins and components, while closely tracking policy developments. Should new tariff measures be enacted, businesses must evaluate supply diversification strategies tailored to specific product groups.
-
Monitor CAPE Refund Processes: Businesses eligible for refunds that submitted their IORs before July 30 should proactively audit and finalize their data, documentation, and entry files in preparation for submission via CAPE when Phase 3 launches on October 6. Advance preparation will streamline the processing workflow and empower businesses to better manage their cash flow planning.
Stay tuned to articles on Phaata.com or Phaata fanpage for rapid and in-depth market updates.
Find Freight Rates Here
Find Logistics Companies Here
See more:
- SITC updates Vietnam-Intra Asia sailing schedules in Oct 2026
- Maritime Tensions: Iran Attacks Vessel in Hormuz as Italy Prepares Independent Red Sea Escort Plan
- SITC – CONNECTING CAMBODIA WITH VIETNAM AND THE WORLD
- Hapag-Lloyd CEO: Container Shipping Demand Remains Resilient Amid Geopolitical Volatility
- US Container Imports Reach 2.6 Million TEU, Third-Highest Volume on Record
- Prolonged Gulf Crisis Raises Biofouling Risks for Idled Vessels
- COSCO Shipping Heavy Industry Begins A-Share Listing Process in Shanghai
- COSCO schedules: Vietnam - North America in Sep 2026
Source: Phaata - Where Shippers & Logistics Providers Connect
► Find Better Freight Rates & Logistics Service Providers!


Featured News
- Hapag-Lloyd applies Peak Season Surcharge from East Asia to USA and Canada
- The world\'s largest container ships MSC Irina and MSC Loreto floated
- MSC (Mediterranean Shipping Company) - The world\'s leading container shipping lines
- Information you need to know about Maersk Line
- Top 10 export and import goods between Vietnam - Philippines in the first 5 months of 2020

 Market News
See more
.webp)

.webp)

.webp)
_(3).webp)

 HOT PROMO
See more
120
 FCL
FCL
 30 Days
 Freight cost

CÔNG TY TNHH PEGASHIP
1452
FCL
45 Days
Freight cost

Compass Logistics
 Premium
3067
FCL
30 Days
Freight cost
Premium
3067
FCL
30 Days
Freight cost

CÔNG TY TNHH INTERNATIONAL LOGISTICS GLORY (VIỆT NAM)
4616
FCL
3 Days
Freight cost

Công ty TNHH Giao nhận vận chuyển Quốc tế Trường Hải - THILOGI
Premium
4421
FCL
10 Days
Freight cost

CÔNG TY TNHH THƯƠNG MẠI VÀ DỊCH VỤ GREEN DRAGON VIỆT NAM
Why do thousands of businesses trust Phaata?
USERS/MONTH
LOGISTICS COMPANIES
REQUEST FOR QUOTEŚ
QUOTATIONS
VIETNAM LOGISTICS COMMUNITY
5 Steps to Get the Best Quote
Find a price quickly/Send a RFQ
Compare multiple options
Contact for Further Consultation
Negotiating prices/services
Management & rating
 Freight rates
Sea freight
- FCL
See more
98
5
Days Direct
- ₫39,694,500 / 40'HQ

CÔNG TY TNHH VẬN CHUYỂN QUỐC TẾ TÂN TOÀN CẦU
194
7
Days Direct
- ₫40,223,760 / 40'HQ

CÔNG TY TRÁCH NHIỆM HỮU HẠN DT LOGISTICS (VN)
215
 263
25
Days Transit
263
25
Days Transit
- ₫30,432,450 / 20'GP
- ₫38,371,350 / 40'GP
- ₫38,371,350 / 40'HQ
- ₫38,371,350 / 45'HQ

T.H.I GROUP VIỆT NAM
225
8
Days Direct
- ₫34,087,300 / 40'HQ

CÔNG TY TNHH VẬN TẢI VÀ TIẾP VẬN TOÀN CẦU
Sea freight
- LCL
See more
1,979
4
Days Direct
- ₫26,463 /cbm

CÔNG TY TNHH IEC EXPRESS (VIỆT NAM)- CHI NHÁNH HÀ NỘI
3,064
5
Days Direct
- ₫26,463 /cbm

CHI NHÁNH TẠI THÀNH PHỐ HỒ CHÍ MINH - CÔNG TY CỔ PHẦN MG LOGISTICS
3,688
8
Days Direct
- Refund ₫2,362,500 /cbm

CÔNG TY CỔ PHẦN TIẾP VẬN INTERCARGO
4,245
4
Days Direct
- ₫26,463 /cbm

CÔNG TY CỔ PHẦN GIAO NHẬN VẬN TẢI MỸ Á (ASL LOGISTICS)
4,274

 Air freight
- General cargo
Air freight
- General cargo
See more
1,048
10
Days Transit
- 264,630 ₫/kg

Phoenix Logistics Vietnam - chi nhánh TP. Hồ Chí Minh (Phoenix International Forwarding Vietnam )
1,781
1
Days Direct
- 185,241 ₫/kg

CÔNG TY TNHH THƯƠNG MẠI VÀ DỊCH VỤ FASTRANS
5,270
 4,951
8
Days Transit
4,951
8
Days Transit
- 224,936 ₫/kg

CÔNG TY TNHH SEA GLOBAL VIỆT NAM
2,780
1
Days Direct
- 502,797 ₫/kg

CÔNG TY TNHH VẬN TẢI QUỐC TẾ GIA PHÚ
 Rail freight
- FCL
Rail freight
- FCL
See more
808
5
Days Direct
- ₫26,463,000 / 40'HQ
- ₫26,463,000 / 45'HQ

CÔNG TY TNHH PHƯỚC TÁ
1,152
3
Days Direct
- ₫6,324,657 / 40'HQ

CÔNG TY CỔ PHẦN VẬN TẢI VÀ THƯƠNG MẠI ĐƯỜNG SẮT
10,464
7
Days Direct
- ₫48,956,550 / 20'GP

Công ty TNHH T&M Forwarding
9,830
5
Days Direct
- ₫7,145,010 / 20'GP

ASIAN EXPRESS LINE VIETNAM ( AEL VIET NAM )
8,215
10
Days Direct
- ₫9,262,050 / 20'GP

CÔNG TY CỔ PHẦN LOGISTICS QUỐC TẾ V&T
 Road freight
- FCL
Road freight
- FCL
See more
42,648
1
Day
- ₫6,868,686 / 20'OT
- ₫6,868,686 / 40'OT
- ₫6,868,686 / 40'OT HQ

CÔNG TY TNHH LIÊN VẬN QUỐC TẾ SHINING OCEAN VIỆT NAM
99,874
2
Day
- ₫6,500,000 / 40'RF
- ₫6,500,000 / 40'RQ
- ₫6,500,000 / 45'RQ

CÔNG TY CP PROSHIP
Premium
170,137
1
Day
- ₫18,997,200 / 20'GP
- ₫18,997,200 / 40'GP

CÔNG TY CỔ PHẦN GIAO NHẬN VẬN TẢI CON ONG
262,469
3
Day
- ₫32,000,000 / 20'GP
- ₫64,000,000 / 40'GP
- ₫64,000,000 / 40'HQ
- ₫64,000,000 / 45'HQ

Công ty Cổ phần phát triển thương mại Thuận Đạt Việt Nam
283,171


