


Monday, 27/04/2026, 17:33 (GMT +7)
 1065
1065
International Shipping and Logistics Market Update Week 17/2026 | Phaata
International shipping and logistics market update - Week 17/2026
Table of Contents
-
World Container Index Week 17/2026
-
Asia - North America Ocean Freight Rates
-
Asia - Europe Ocean Freight Rates
-
Northern America - Asia Ocean Freight Rates
-
Northern Europe - Asia Ocean Freight Rates
-
Conclusions and Recommendations by Phaata
1. World Container Index Week 17/2026
Drewry’s World Container Index (WCI) for Week 17/2026 (from April 20 to April 26, 2026) remained stable compared to the previous week, settling at $2,232/FEU.
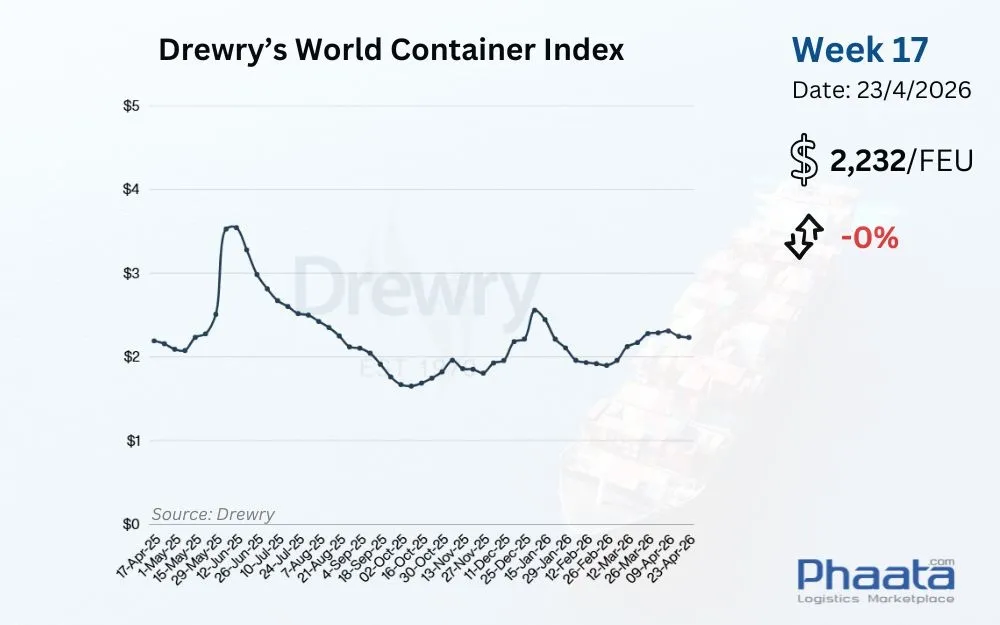
Drewry's World Container Index Week 17/2026 (Photo: Phaata)
2. Asia-North America Ocean Freight Rates
Supply and Demand:
Demand Side:
The market recorded a sudden spike in export cargo volumes in late April. This is a direct consequence of shippers rushing to push cargo out before the International Labor Day (May 1) holiday.
Supply Side:
Carriers have locked in plans to step up blank sailings in the upcoming month of May. The convergence of a localized volume spike and reduced operational capacity is causing vessel space to become exceptionally tight.
Space restrictions on long-term contracts: Carriers are strictly limiting space allocations based on Named Account Contracts (NAC) on certain service loops to prioritize space for cargo bearing higher spot rates.
Operations:
Localized 40'HC Tension: Localized shortages of 40'HC (High Cube) empty containers have begun to materialize at select origin ports. However, on an overall trade-lane level, the volume of empty equipment remains within manageable limits and has not yet caused widespread turnaround disruptions.
Rate Developments:
Ocean Freight rates from Asia to the North America West Coast in Week 17/2026 increased slightly by 0.96% week-on-week, reaching $2,832/FEU. This rate is up 27.74% month-on-month, according to Xeneta data.
- Floating Rates Extended: Carriers successfully anchored spot market rates through the end of April. Facing competitive pressure, some carriers have agreed to extend current rate levels into early May.
- Fuel Surcharge Adjustments: * The Emergency Bunker Surcharge (EBS) applied to the ocean leg remains in effect.
-
Carriers are readjusting their periodic Bunker Adjustment Factors (BAF) effective May 1.
-
The Intermodal Fuel Surcharge (IFS) has been officially implemented to offset diesel costs for intermodal connection legs (rail/truck).
- Peak Season Surcharge (PSS) Delayed: Because cost pressures in May have been pushed exceedingly high by a raft of fuel surcharges, carriers are forced to push the PSS application timeline to the second half of May. Analysts even assess that carriers may have to further delay the PSS to June 1 to gauge the market's reaction.
Stay tuned to Phaata International Logistics Marketplace for in-depth and fast market updates.
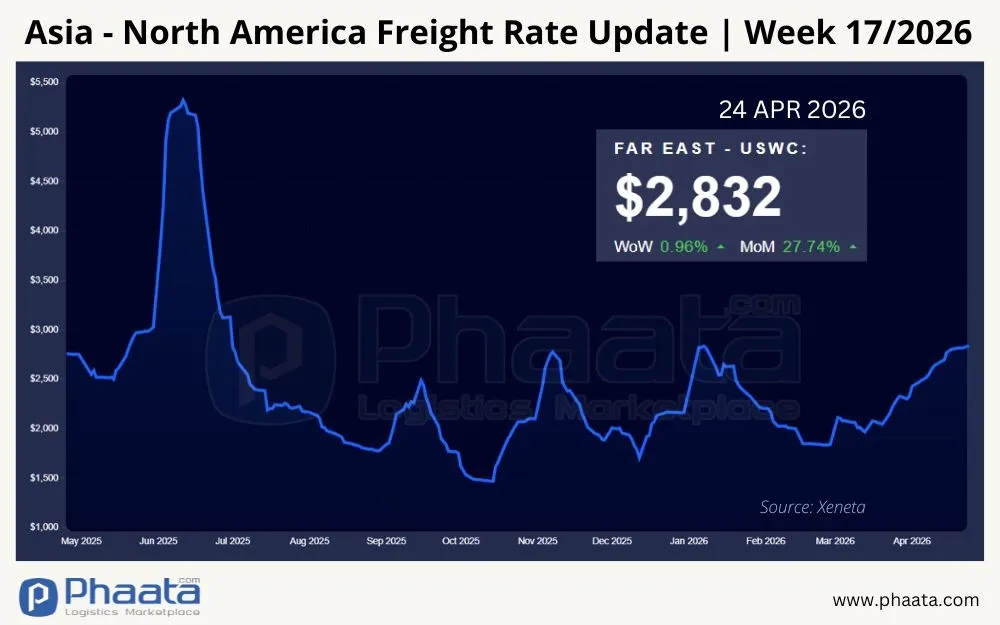
Asia-North America Freight Rates | Week 17/2026 (Photo: Phaata.com)
US Tariff Updates:
1. CAPE System Phase 1 Launch and Declaration Discrepancy Risks
On April 20, 2026, US Customs and Border Protection (CBP) officially launched Phase 1 of the IEEPA Centralized Account Processing and Management Environment (CAPE) refund system. Disbursements will be made directly via ACH to the Importer of Record's (IOR) account. However, this process demands absolute accuracy in data auditing:
- Post Summary Correction (PSC) Conflict:
-
Once an entry is successfully accepted into the CAPE system, the importer is strictly prohibited from using a PSC to amend the data.
-
Conversely, if an entry is rejected by CAPE, the business is permitted to file a PSC to correct the error and then push it back into the system. Previously filed PSCs remain valid for CAPE submission.
- Error Rate Warning: Internal audit data shows an average error rate of up to 20% on customs entries. Rushing to submit applications to CAPE without cross-auditing could cost a business a total loss of 20% of their refund value, while simultaneously exposing them to CBP administrative penalties for misdeclarations.
- Fragmented Disbursement Timeline:
-
For unliquidated entries or those recently liquidated within the past 80 days (comprising the 63% processed in Phase 1): Refunds are expected to hit accounts 60 to 90 days after CAPE accepts the file.
-
Suspended entries, extended entries, or goods entered into bonded warehouses will only be refunded after official final liquidation.
-
Phase 2 (reserved for finally liquidated entries, Duty Drawback, Reconciliation, etc.) currently has no specific deployment timeline.
2. Section 232 Tariff Preferences for the Auto Parts Industry (Canada & Mexico)
The US Department of Commerce (DOC) has issued a review process to reduce Section 232 tariffs on steel and aluminum originating from Canada and Mexico, applicable immediately starting April 23, 2026:
- Preferential Mechanism: Eligible suppliers will see their tariff rate reduced from 50% to 25%.
- Strict Binding Conditions: 1. The metal must be smelted/cast/poured directly in Canada or Mexico and meet USMCA rules of origin. 2. The manufacturer must commit to establishing a new production line within the US, exclusively supplying the automotive or medium/heavy-duty vehicle (MHDV) industry. 3. The 25% preferential rate only applies to a production volume quota equivalent to the output generated by the new US facility.
- Oversight Mechanism: Businesses must submit quarterly reconciliation reports. Violating commitments will result in the retroactive clawback of the entire tax differential (reverting to the 50% rate).
3. Re-evaluating Geopolitical Risks and Long-Term Tariffs
- Cooling of 50% Tariff Risk on China: The threat of the US imposing a 50% punitive tariff on Chinese goods (citing the supply of weapons to Iran) has been temporarily lifted after President Trump confirmed Beijing committed to halting these transfers.
- Cost of Goods Sold (COGS) Control Post-April 6: For the metals group (steel, aluminum, copper), importers are mandated to apply the new Section 232 tariff formula (50% or 25%) based on the total commercial value of the finished product.
- Preparing for Pharmaceutical Section 232 Tariffs: The roadmap to apply a 100% tariff on patented drugs non-compliant with MFN pricing remains unchanged, triggering on July 31, 2026 (for major corporations).
Stay tuned to articles on the Phaata International Logistics Marketplace for rapid and in-depth market updates.
3. Asia-Europe Ocean Freight Rates
Supply and Demand:
Demand:
The retail outlook in the European market remains bleak. The European Central Bank (ECB) downgrading GDP growth forecasts and upgrading inflation forecasts reflects reality: exorbitant energy costs are directly eroding consumer purchasing power for general merchandise.
Compensatory Growth Driver: The slump in consumer goods is partially being backfilled by a boom in export volumes from China for new energy tech products, particularly electric vehicles (EVs), storage batteries, and solar components.
Supply:
To cope with the low demand baseline, carriers are resolutely maintaining tight supply discipline via blank sailing programs, with an average cut frequency reaching 4 sailings/week across the Asia-Europe trade.
Operations:
Seaport Operational Hotspots and Inland Congestion:
- At Port of Loading (Qingdao - China): Dense fog combined with vessel bunching is severely reducing operational efficiency. Berthing wait times have currently been pushed up to an average of 48 hours.
- At Transshipment Hub (Singapore): Congestion has cooled down compared to previous weeks. Berthing wait times are currently holding steady at 24 hours.
- At Destination Ports (Antwerp, Hamburg, Rotterdam cluster): The North European infrastructure network is under immense pressure. Mega-ships arriving simultaneously are overloading terminal discharging systems. The cascading effect is that yard dwell times awaiting inland connection via barge and rail have been prolonged by 2 to 3 days.
Freight Rate Developments:
Ocean Freight rates from Asia to Europe in Week 17/2026 decreased by 4.38% week-on-week, down to $2,531/FEU. This rate is down 9.41% month-on-month, according to Xeneta data.
- Spot Rate Slide: Pressure from weak purchasing power and the injection of capacity from newbuild vessels continues to drive spot rates down. The Shanghai Containerized Freight Index (SCFI) for the North Europe route retreated to the $1,501/TEU mark in Week 17.
- Defending the Price Floor: Despite the sliding general index, actual market freight rates have maintained a stable sideways posture. Carriers are defending the baseline price floor very successfully by combining two tools: (1) Withdrawing capacity through continuous blank sailings, and (2) Rigidly imposing the Emergency Bunker Surcharge (EBS).
Stay tuned to Phaata International Logistics Marketplace for in-depth and fast market updates.
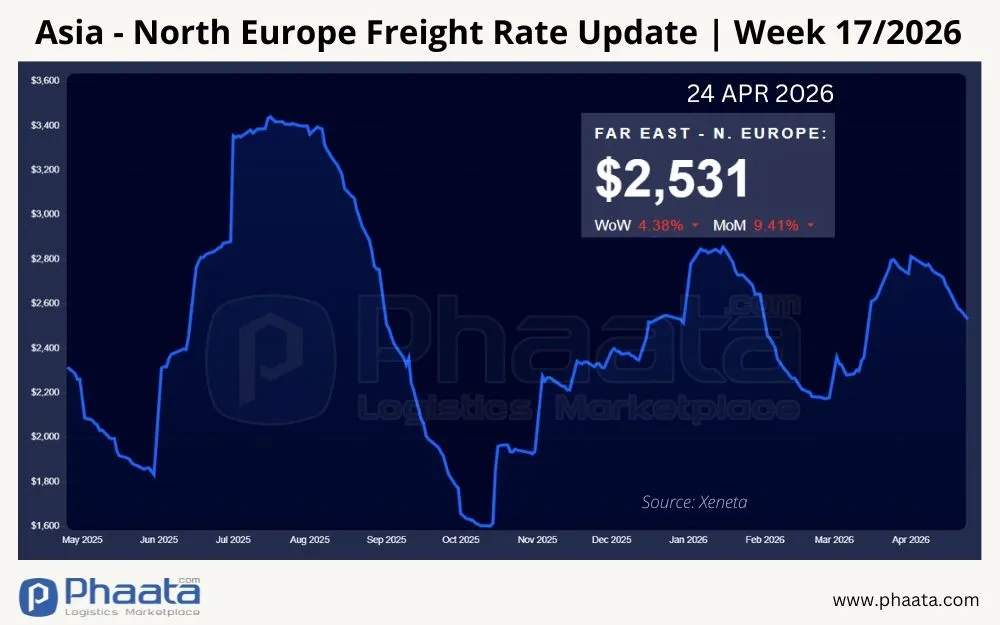
Asia-Europe Freight Rates | Week 17/2026 (Photo: Phaata.com)
4. North America - Asia Ocean Freight Rates
Ocean Freight rates from North America (West Coast) to Asia in Week 17/2026 continued to increase slightly by 1.13% week-on-week, up to $626/FEU. This rate is up 7.19% month-on-month, according to Xeneta data.
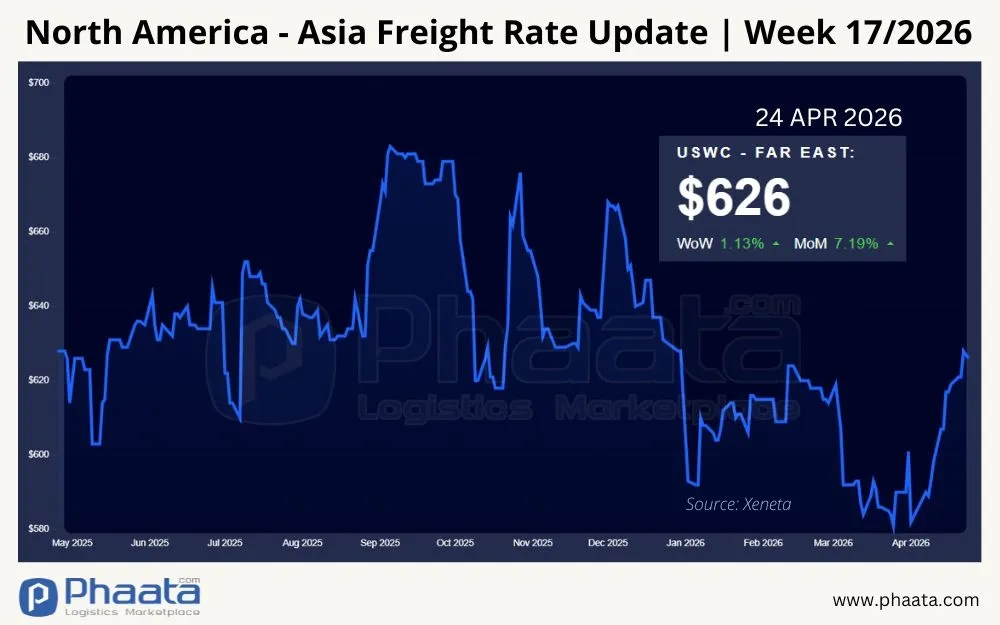
North America (West Coast) - Asia freight rates | Week 17/2026 (Photo: Phaata.com)
5. Northern Europe - Asia Ocean Freight Rates
Ocean Freight rates from North Europe to Asia in Week 17/2026 increased by 2.49% week-on-week, up to $247/FEU. This rate is up 33.51% month-on-month, per Xeneta data.
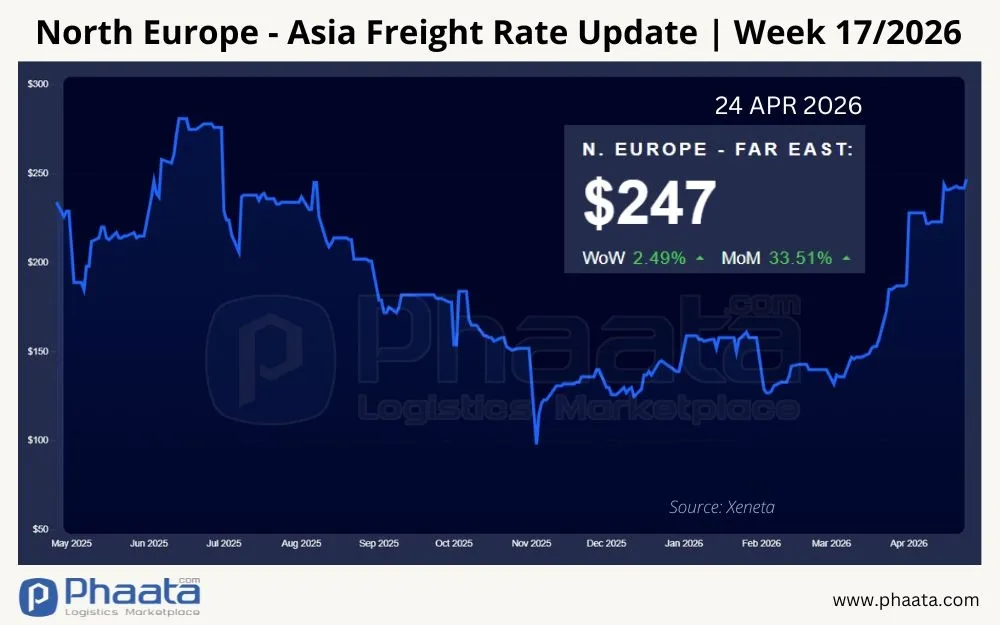
Container Freight rates from Northern Europe to Asia | Week 17/2026 (Photo: Phaata.com)
6. Conclusion and Recommendations from Phaata
Data from Week 17/2026 reveals a distinct divergence in volumes and direct risks in the execution of customs legalities:
- Tight Space to North America, Sliding Rates to Europe: The Asia-North America route is facing localized 40'HC shortages and space restrictions on long-term contracts (NAC) as the pre-May 1 export volume spike collides with blank sailings. Conversely, the Asia-Europe route continues to see sliding prices (down 4.38%) due to weak retail purchasing power, with current volumes primarily propped up by the energy tech sector (EVs, batteries, solar).
- Physical Congestion at Origin and Destination Ports: The European cargo turnaround chain is squeezed at both ends: the Qingdao loading port is fog-bound (48-hour wait) and North European destination ports are congested by vessel bunching (2-3 day yard dwell time awaiting barge/rail connections).
- Technical Risks from the CAPE System: CBP's official launch of the IEEPA refund system (CAPE) comes with a strict ban on Post Summary Corrections (PSC) post-submission. With an average data error rate of 20%, importers face the risk of directly losing 20% of their refund cash flow if they submit files without rigorous cross-auditing.
Recommendations from Phaata
Based on actual market volatility, businesses must heed the following to protect cash flow and maintain delivery schedules:
1. Logistics and Order Management:
- North America Route - Capitalize on the PSS Delay: Carriers have pushed the Peak Season Surcharge (PSS) to the second half of May or early June. The documentation department must capitalize on this time window to expedite exports. Mandate agents to firmly secure empty release orders for 40'HCs at least 14 days in advance to avoid equipment shortages.
- Europe Route - Buffer Delay Margins: Directly add 5 to 7 days to the Estimated Lead Time on contracts for shipments originating from the Northern China port cluster (Qingdao) discharging in North Europe, to offset vessel berthing wait times and inland turnaround delays.
2. Customs and Cash Flow Management (US Market):
- Cross-Audit Before CAPE Submission: Absolutely do not push entry data directly into the CAPE system without a prior audit. The import-export department must scan for errors on every single entry. If an error is detected, it is mandatory to file a Post Summary Correction (PSC) to fix the error first, and only then push the corrected entry to the CAPE portal to guarantee 100% receipt of valid refunds.
- Apply the New Section 232 Calculation Formula: For shipments containing metals (steel, aluminum, copper), the accounting department must calculate the 50% (or 25% for derivatives) tariff based on the entire commercial invoice value of the finished product arriving at port from April 6 onward.
- File for Auto Parts Tariff Preferences: Auto parts and truck manufacturers with foundries in Canada or Mexico should immediately submit applications to the US Department of Commerce (DOC) along with production reports to request approval for the reduced 25% tariff rate (down from 50%). Immediately activate quarterly volume tracking operations to maintain this preferential status.
Stay tuned to articles on Phaata.com or Phaata fanpage for rapid and in-depth market updates.
Find Freight Rates Here
Find Logistics Companies Here
See more:
- COSCO Shipping and Sepetiba Tecon Sign 10-Year Agreement: Elevating the Brazil-China Trade Route
- Ocean Freight Surcharges Soar Amid Hormuz Crisis: Massive Pressure on Contract Negotiation Season
- IMO Tightens Ship Registration Guidelines Amid a Wave of Fraudulent Flagging
- Hormuz Crisis: Top Global Shipping Lines Demand Absolute Guarantees of Safe Passage
- Hormuz Tensions: IRGC Claims Seizure of Two MSC Containerships in Retaliation Against US
- CMA CGM Announces FAK Rate Increase on the Asia-Mediterranean Trade Lane Starting May 2026
- Phaata Joins Global Sourcing Fair Vietnam 2026 as a Supporting Partner
- Hormuz Fertilizer Supply Chain Disruption: A Cascading Shock to Global Shipping and Agricultural Economics
- Red Sea Crisis Reshapes the Global Air Freight Network Structure
- COSCO updates Vietnam-Intra Asia sailing schedules in Apr 2026
- COSCO schedules: Vietnam - North America in Apr 2026
- SITC updates Vietnam-Intra Asia sailing schedules in Apr 2026
Source: Phaata - Vietnam's First International Logistics Marketplace
► Find Better Freight Rates & Logistics Service Providers!


Featured News
- Hapag-Lloyd applies Peak Season Surcharge from East Asia to USA and Canada
- The world\'s largest container ships MSC Irina and MSC Loreto floated
- MSC (Mediterranean Shipping Company) - The world\'s leading container shipping lines
- Information you need to know about Maersk Line
- Top 10 export and import goods between Vietnam - Philippines in the first 5 months of 2020

 Market News
See more



_-_Copy.webp)
.webp)

 HOT PROMO
See more
813
 FCL
FCL
 2 Days
 Freight cost

CÔNG TY TNHH PIO LOGISTICS
1720
FCL
31 Days
Freight cost

CÔNG TY TRÁCH NHIỆM HỮU HẠN DT LOGISTICS (VN)
2775
FCL
30 Days
Freight cost

CÔNG TY TNHH PEGASHIP
4359
FCL
45 Days
Freight cost

Compass Logistics
 Premium
5407
FCL
30 Days
Freight cost
Premium
5407
FCL
30 Days
Freight cost

CÔNG TY TNHH INTERNATIONAL LOGISTICS GLORY (VIỆT NAM)
Why do thousands of businesses trust Phaata?
USERS/MONTH
LOGISTICS COMPANIES
REQUEST FOR QUOTEŚ
QUOTATIONS
VIETNAM LOGISTICS COMMUNITY
5 Steps to Get the Best Quote
Find a price quickly/Send a RFQ
Compare multiple options
Contact for Further Consultation
Negotiating prices/services
Management & rating
 Freight rates
Sea freight
- FCL
See more
13
40
Days Direct
- ₫196,223,145 / 20'GP
- ₫229,301,895 / 40'GP
- ₫229,301,895 / 40'HQ

ALLIANCE INTERNATIONAL LOGISTICS CO., LTD
Premium
231
 248
22
Days Direct
248
22
Days Direct
- ₫179,948,400 / 40'RQ

CÔNG TY CỔ PHẦN QUỐC TẾ ANVY
242
13
Days Direct
- ₫75,419,550 / 40'RQ

CÔNG TY TNHH VẬN CHUYỂN QUỐC TẾ RYLOGS
209
35
Days Direct
- ₫195,826,200 / 20'GP
- ₫243,459,600 / 40'GP
- ₫243,459,600 / 40'HQ

CÔNG TY TNHH TIẾP VẬN TOÀN CẦU KM
Sea freight
- LCL
See more
632
7
Days Direct
- ₫105,852 /cbm

Công ty Cổ phần vận tải xuyên đại dương OVC
3,219
4
Days Direct
- ₫26,463 /cbm

CÔNG TY TNHH IEC EXPRESS (VIỆT NAM)- CHI NHÁNH HÀ NỘI
4,283
5
Days Direct
- ₫26,463 /cbm

CHI NHÁNH TẠI THÀNH PHỐ HỒ CHÍ MINH - CÔNG TY CỔ PHẦN MG LOGISTICS
4,698
8
Days Direct
- Refund ₫2,362,500 /cbm

CÔNG TY CỔ PHẦN TIẾP VẬN INTERCARGO
4,914
4
Days Direct
- ₫26,463 /cbm

CÔNG TY CỔ PHẦN GIAO NHẬN VẬN TẢI MỸ Á (ASL LOGISTICS)
 Air freight
- General cargo
Air freight
- General cargo
See more
1,761
10
Days Transit
- 264,630 ₫/kg

Phoenix Logistics Vietnam - chi nhánh TP. Hồ Chí Minh (Phoenix International Forwarding Vietnam )
2,856
1
Days Direct
- 185,241 ₫/kg

CÔNG TY TNHH THƯƠNG MẠI VÀ DỊCH VỤ FASTRANS
6,195
 5,763
8
Days Transit
5,763
8
Days Transit
- 224,936 ₫/kg

CÔNG TY TNHH SEA GLOBAL VIỆT NAM
3,155
1
Days Direct
- 502,797 ₫/kg

CÔNG TY TNHH VẬN TẢI QUỐC TẾ GIA PHÚ
 Rail freight
- FCL
Rail freight
- FCL
See more
41
5
Days Direct
- ₫44,987,100 / 40'HQ
- ₫44,987,100 / 45'HQ

CÔNG TY TNHH PHƯỚC TÁ
327
3
Days Direct
- ₫15,083,910 / 40'HQ

CÔNG TY CỔ PHẦN VẬN TẢI VÀ THƯƠNG MẠI ĐƯỜNG SẮT
11,289
7
Days Direct
- ₫48,956,550 / 20'GP

Công ty TNHH T&M Forwarding
10,516
5
Days Direct
- ₫7,145,010 / 20'GP

ASIAN EXPRESS LINE VIETNAM ( AEL VIET NAM )
8,526
10
Days Direct
- ₫9,262,050 / 20'GP

CÔNG TY CỔ PHẦN LOGISTICS QUỐC TẾ V&T
 Road freight
- FCL
Road freight
- FCL
See more
43
1
Day
- ₫28,000,000 / 20'GP
- ₫28,000,000 / 40'GP

CÔNG TY TNHH THƯƠNG MẠI DỊCH VỤ VÀ KHO VẬN VIETTEL POST - TTC
69
4
Day
- ₫211,704 / 20'GP

CÔNG TY CỔ PHẦN KINH DOANH THƯƠNG MẠI VÀ DỊCH VỤ HỎA TỐC
43,350
1
Day
- ₫6,868,686 / 20'OT
- ₫6,868,686 / 40'OT
- ₫6,868,686 / 40'OT HQ

CÔNG TY TNHH LIÊN VẬN QUỐC TẾ SHINING OCEAN VIỆT NAM
101,103
2
Day
- ₫6,500,000 / 40'RF
- ₫6,500,000 / 40'RQ
- ₫6,500,000 / 45'RQ

CÔNG TY CP PROSHIP
Premium
171,148
1
Day
- ₫18,997,200 / 20'GP
- ₫18,997,200 / 40'GP

CÔNG TY CỔ PHẦN GIAO NHẬN VẬN TẢI CON ONG


