

Wednesday, 24/06/2026, 11:02 (GMT +7)
 469
469
Container Shipping Resilience: A Deeper Look Behind Faster Recovery Times
.webp)
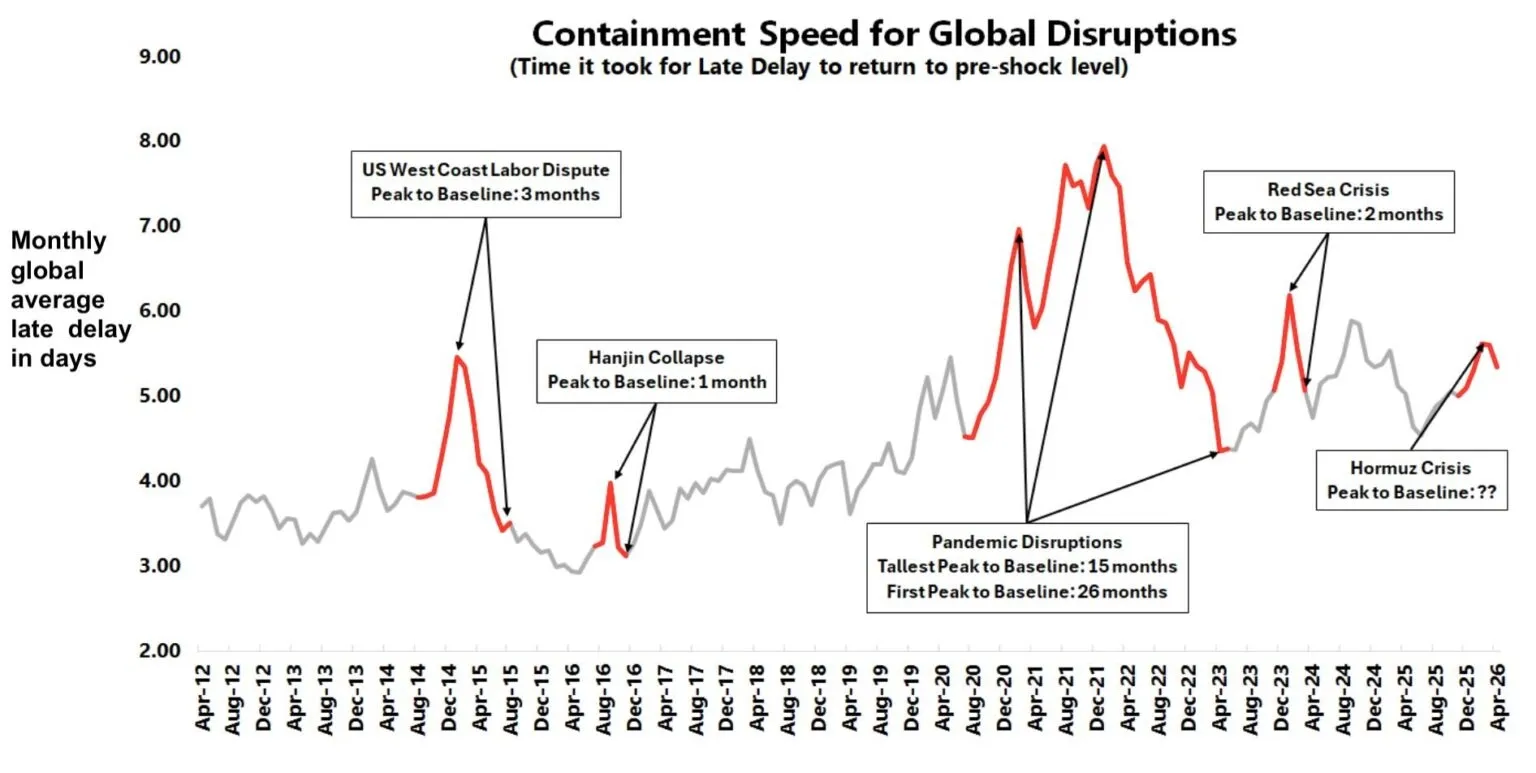
A newly released analysis by Sea-Intelligence examines the recovery performance of the container shipping industry following major disruptions since 2012. The index measures the time required for vessel schedule reliability to return to normal after significant shocks affecting supply chains and maritime transport networks.
Source: Sea Intelligence
The data indicates that recovery periods have shortened considerably over time. It took approximately three months for the industry to stabilize following the 2014 U.S. West Coast port labor dispute, one month after the collapse of Hanjin Shipping in 2016, between 15 and 26 months to recover from the impacts of the COVID-19 pandemic, and only around two months following the Red Sea crisis and the widespread rerouting of vessels via the Cape of Good Hope. The situation in the Strait of Hormuz, meanwhile, remains an evolving variable whose full impact has yet to be assessed.
At first glance, the logistics industry appears to be adapting more effectively to disruptions. However, many experts believe the reality is more complex than the headline figures suggest.
Trading Speed for Network Stability
According to Imaad Asad, Maritime Analyst at Sea-Intelligence, operational risks have not disappeared; rather, shipping networks have been redesigned to absorb disruptions more effectively.
He explained: “The chaos hasn’t disappeared; the shipping networks are just absorbing them better.”
Elaborating further, Asad noted: “Shipping lines have fundamentally shifted their operational strategy to proactively adding buffers into their schedules. During the pandemic, the lack of transit buffers meant that any disruption quickly cascaded into a system-wide failure. Now, by structurally extending transit times upfront, shipping lines are absorbing the shock of these events before they can spread.”
In practice, container shipping has accepted longer transit times and larger schedule buffers in exchange for greater network stability. This approach has helped carriers reduce the cascading effects that often accompany new disruptions.
Excess Vessel Capacity Provides a Market Buffer
Looking deeper into market fundamentals, Simon Heaney, Senior Manager of Container Research at Drewry, believes that faster recovery is not solely the result of improved management but also reflects the varying scale of different crises.
He commented: “As usual it’s a combination of factors. The crises are of vastly different magnitudes; for container shipping Hormuz is significantly less operationally disruptive than Red Sea diversions, which in turn was relatively minor compared to covid.”
Heaney also emphasized that excess fleet capacity has played a critical role in strengthening industry resilience: “The industry has learned to adapt to a state of perma-crisis, which is helped by having an excess of ships to move about the chess board. Therefore, disruption has diminishing returns for liners. The golden ticket for them is when an event causes a demand upsurge and logistics capacity crunch at the same time. That has happened only on a small scale with Hormuz.”
Judah Levine, Head of Research at Freightos, shares a similar view, arguing that the scale of each disruption remains the determining factor.
The COVID-19 pandemic triggered unprecedented port congestion on a global scale. By comparison, the Red Sea crisis caused significant disruption but remained largely confined to part of the global container network, while carriers still retained the option of rerouting vessels via the Cape of Good Hope. Current tensions in the Strait of Hormuz affect only an estimated 2–3% of global container volumes.
Levine observed: “The level of delays and recovery times are mostly commensurate with the degree of the disruptions.”
He also noted that lessons learned during the pandemic - particularly the importance of maintaining reserve capacity - are now being widely applied to improve resilience against future shocks.
Congestion and Delays Remain Long-Term Challenges
Not all experts, however, view Sea-Intelligence’s findings as evidence of a fully recovered industry.
Peter Tirschwell, founder of the TPM conference, offered a more cautious perspective: “What is most relevant is that delays are getting worse as time goes on, not that recovery from shocks may be occurring faster.”
To support his argument, Tirschwell pointed to the World Bank’s Container Port Performance Index (CPPI), which shows that productivity at many major ports - measured by container moves per hour - has yet to return to pre-pandemic levels.
He added: “Container carrier leaders speak of long-term worsening of port delays as a reality the industry will have to face likely for years to come.”
Volatility Is Becoming Structural
Peter Sand, Chief Analyst at Xeneta, shares similar concerns and argues that both the frequency and nature of supply chain disruptions have changed significantly since the pandemic.
He stated: “The frequency of disruptions is higher since the onset of covid - and the impact is more severe compared to pre-covid.”
He further emphasized: “Crises are always different. If you fail to distinguish the differences and thus also the impact - you get hit.”
According to Sand, volatility in global supply chains and maritime transportation is no longer a cyclical risk but is increasingly becoming a structural characteristic of the operating environment.
The Gap Between Resilience and Operational Reality
The difference between system resilience and the actual health of supply chains is clearly reflected in the Global Supply Chain Stress Index.
The index currently indicates that the volume of containers affected by bottlenecks and delays across global supply chains has reached its highest level since the peak of the pandemic, with more than 2 million TEUs experiencing supply chain stress. This comes despite Sea-Intelligence data suggesting that individual disruptions are being absorbed more quickly.
At the same time, the Shanghai Containerized Freight Index (SCFI) has climbed back above the threshold of USD 2,000 per TEU.
Overall, faster recovery from isolated operational disruptions is undoubtedly a positive development for the container shipping industry. However, shorter recovery times do not necessarily mean that the underlying pressures within global supply chains have been resolved. Persistent congestion at major ports, elevated levels of stranded container volumes, and the increasing frequency of geopolitical disruptions all suggest that global supply chains continue to operate in a far more volatile environment than they did before the pandemic.
See more:
- US–Iran 'Hotline' Established for the Strait of Hormuz: Diplomatic Progress Meets Maritime Challenges
- Port of Melbourne Reports Positive Container Throughput Growth in May
- International Shipping and Logistics Market Update Week 25/2026 | Phaata
- CMA CGM Implements Peak Season Surcharge (PSS) Across Multiple Key Trade Lanes
- Maersk Expands WAF7 Service to South Africa to Support Peak Fruit Export Season
- MSC Restructures Intra-Far East Service Network
- U.S. Container Imports from Asia Rise 17.5%; China Rebounds While Vietnam Extends Growth Streak
- Maritime Traffic Through the Strait of Hormuz Begins to Resume, but Challenges Remain
- DP World Enters Exclusive Talks to Develop First Container Terminal on the U.S. Gulf Coast
- Port of Helsinki Records 9.4% Growth in Container Traffic in Early 2026
- 5 Compliance Blind Spots Exposing the Air Cargo Industry to Hidden Risks
- COSCO schedules: Vietnam - North America in Jun 2026
- COSCO updates Vietnam-Intra Asia sailing schedules in Jun 2026
- COSCO updates Vietnam-North Europe sailing schedules in Jun 2026
- SITC updates Vietnam-Intra Asia sailing schedules in Jun 2026
Source: Phaata.com (According to Splash247)
► Find Better Freight Rates & Logistics Service Providers!


Featured News
- Hapag-Lloyd applies Peak Season Surcharge from East Asia to USA and Canada
- The world\'s largest container ships MSC Irina and MSC Loreto floated
- MSC (Mediterranean Shipping Company) - The world\'s leading container shipping lines
- Information you need to know about Maersk Line
- Top 10 export and import goods between Vietnam - Philippines in the first 5 months of 2020

 Market News
See more
_-_Copy.webp)
.webp)
.webp)

 HOT PROMO
See more
10
 FCL
FCL
 2 Days
 Freight cost

CÔNG TY TNHH PIO LOGISTICS
652
FCL
31 Days
Freight cost

CÔNG TY TRÁCH NHIỆM HỮU HẠN DT LOGISTICS (VN)
1726
FCL
30 Days
Freight cost

CÔNG TY TNHH PEGASHIP
3462
FCL
45 Days
Freight cost

Compass Logistics
 Premium
5036
FCL
30 Days
Freight cost
Premium
5036
FCL
30 Days
Freight cost

CÔNG TY TNHH INTERNATIONAL LOGISTICS GLORY (VIỆT NAM)
Why do thousands of businesses trust Phaata?
USERS/MONTH
LOGISTICS COMPANIES
REQUEST FOR QUOTEŚ
QUOTATIONS
VIETNAM LOGISTICS COMMUNITY
5 Steps to Get the Best Quote
Find a price quickly/Send a RFQ
Compare multiple options
Contact for Further Consultation
Negotiating prices/services
Management & rating
 Freight rates
Sea freight
- FCL
See more
20
26
Days Direct
- ₫149,251,320 / 20'GP
- ₫185,241,000 / 40'GP
- ₫185,241,000 / 40'HQ

CÔNG TY TNHH TIẾP VẬN TOÀN CẦU KM
221
5
Days Direct
- ₫22,493,550 / 20'GP
- ₫44,987,100 / 40'HQ

CÔNG TY TNHH NGUYÊN ĐĂNG VIỆT NAM
347
10
Days Direct
- ₫46,310,250 / 40'HQ
CÔNG TY TNHH INTERNATIONAL LOGISTICS GLORY (VIỆT NAM)
387
4
Days Direct
- ₫529,260 / 20'GP
CÔNG TY TRÁCH NHIỆM HỮU HẠN DT LOGISTICS (VN)
436

Sea freight
- LCL
See more
435
7
Days Direct
- ₫105,852 /cbm

Công ty Cổ phần vận tải xuyên đại dương OVC
2,916
4
Days Direct
- ₫26,463 /cbm

CÔNG TY TNHH IEC EXPRESS (VIỆT NAM)- CHI NHÁNH HÀ NỘI
3,995
5
Days Direct
- ₫26,463 /cbm

CHI NHÁNH TẠI THÀNH PHỐ HỒ CHÍ MINH - CÔNG TY CỔ PHẦN MG LOGISTICS
4,448
8
Days Direct
- Refund ₫2,362,500 /cbm

CÔNG TY CỔ PHẦN TIẾP VẬN INTERCARGO
4,762
4
Days Direct
- ₫26,463 /cbm

CÔNG TY CỔ PHẦN GIAO NHẬN VẬN TẢI MỸ Á (ASL LOGISTICS)
 Air freight
- General cargo
Air freight
- General cargo
See more
1,603
10
Days Transit
- 264,630 ₫/kg

Phoenix Logistics Vietnam - chi nhánh TP. Hồ Chí Minh (Phoenix International Forwarding Vietnam )
2,635
1
Days Direct
- 185,241 ₫/kg

CÔNG TY TNHH THƯƠNG MẠI VÀ DỊCH VỤ FASTRANS
5,990
 5,572
8
Days Transit
5,572
8
Days Transit
- 224,936 ₫/kg

CÔNG TY TNHH SEA GLOBAL VIỆT NAM
3,053
1
Days Direct
- 502,797 ₫/kg

CÔNG TY TNHH VẬN TẢI QUỐC TẾ GIA PHÚ
 Rail freight
- FCL
Rail freight
- FCL
See more
163
3
Days Direct
- ₫15,083,910 / 40'HQ

CÔNG TY CỔ PHẦN VẬN TẢI VÀ THƯƠNG MẠI ĐƯỜNG SẮT
1,499
5
Days Direct
- ₫26,463,000 / 40'HQ
- ₫26,463,000 / 45'HQ

CÔNG TY TNHH PHƯỚC TÁ
11,099
7
Days Direct
- ₫48,956,550 / 20'GP

Công ty TNHH T&M Forwarding
10,348
5
Days Direct
- ₫7,145,010 / 20'GP
ASIAN EXPRESS LINE VIETNAM ( AEL VIET NAM )
8,439
10
Days Direct
- ₫9,262,050 / 20'GP

CÔNG TY CỔ PHẦN LOGISTICS QUỐC TẾ V&T
 Road freight
- FCL
Road freight
- FCL
See more
43,167
1
Day
- ₫6,868,686 / 20'OT
- ₫6,868,686 / 40'OT
- ₫6,868,686 / 40'OT HQ

CÔNG TY TNHH LIÊN VẬN QUỐC TẾ SHINING OCEAN VIỆT NAM
100,855
2
Day
- ₫6,500,000 / 40'RF
- ₫6,500,000 / 40'RQ
- ₫6,500,000 / 45'RQ

CÔNG TY CP PROSHIP
Premium
170,963
1
Day
- ₫18,997,200 / 20'GP
- ₫18,997,200 / 40'GP

CÔNG TY CỔ PHẦN GIAO NHẬN VẬN TẢI CON ONG
263,206
3
Day
- ₫32,000,000 / 20'GP
- ₫64,000,000 / 40'GP
- ₫64,000,000 / 40'HQ
- ₫64,000,000 / 45'HQ

Công ty Cổ phần phát triển thương mại Thuận Đạt Việt Nam
283,631


