


Tuesday, 29/09/2026, 12:00 (GMT +7)
 103
103
International Shipping and Logistics Market Update Week 39/2026 | Phaata

International shipping and logistics market update - Week 39/2026
Table of Contents
-
World Container Index Week 39/2026
-
Asia - North America Ocean Freight Rates
-
Asia - Europe Ocean Freight Rates
-
Northern America - Asia Ocean Freight Rates
-
Northern Europe - Asia Ocean Freight Rates
-
Conclusions and Recommendations by Phaata
1. World Container Index Week 39/2026
Drewry’s World Container Index (WCI) for Week 39/2026 (from September 21 to September 27, 2026) decreased by 0.71% compared to the previous week, settling at $4,468/FEU.
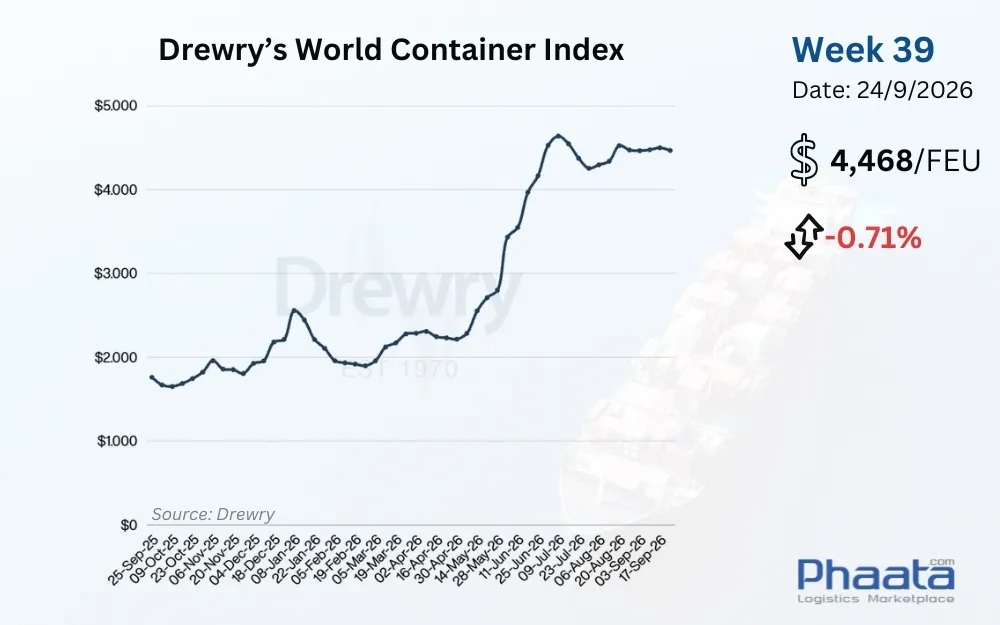
Drewry's World Container Index Week 39/2026 (Photo: Phaata)
2. Asia-North America Ocean Freight Rates
Supply and Demand:
High Capacity Sustained with October Adjustments Ahead: Carriers continue to operate at near 100% of design capacity through the end of September. Notably, capacity allocated to the U.S. East Coast (USEC) increased by approximately 6-7% compared to August. Heading into October, supply is slated for seasonal recalibration, with blank sailings rolling out starting the week of October 5. The capacity adjustment rate is projected to hit roughly 18% during the week of October 12, before tapering off to around 5% by month-end.
Impact of Chinese Holidays: The Mid-Autumn Festival (Sept 25-27) closely precedes Golden Week (Oct 1-7), potentially disrupting manufacturing operations in China for about 10 days. This dynamic is highly likely to trigger a temporary dip in export cargo volumes in early October.
Origin Port Pressure: Operational recovery at several Chinese port clusters requires more time following the impact of successive typhoons. An estimated 1.1 million TEUs are currently backlogged at anchorages across Ningbo, Shanghai, and Yantian, which could continue to constrain operational capabilities in the short term. Weather conditions in late September also remain a critical variable to monitor.
U.S. Import Volumes Remain Elevated: Total container throughput at U.S. ports is forecast to reach approximately 2.31 million TEUs in September, a 9.6% year-over-year (YoY) increase, making it the highest-volume month of 2026. October volumes are projected at roughly 2.11 million TEUs (+1.7% YoY), indicating that import demand remains relatively robust.
Rail Dwell Times: North American inland rail connectivity continues to face mounting pressure. Rail dwell times at Los Angeles and Long Beach averaged roughly 6.75 days in August, demonstrating that container processing and turnaround times in this region remain elevated.
Rate Developments:
Ocean freight rates from Asia to the North America West Coast in Week 39/2026 increased by 2.29% week-on-week, reaching $8,217/FEU. This rate is up 13.40% month-on-month, according to Xeneta data.
Spot Rates Continue to Climb: The rate baseline on the Asia - North America corridor is undergoing further upward adjustments. Shanghai - Los Angeles rates rose approximately 5% week-on-week (WoW), while the Shanghai - New York route saw a roughly 7% increase.
Spot Rates Approaching Cycle Highs: Spot rate indices bound for the West Coast (USWC) jumped 7.45%, and East Coast (USEC) rates rose 4.71%. Compared to pandemic-era peaks, current rate baselines are only about 18% lower for the USWC and 11% lower for the USEC.
Early October Outlook: The rate baseline may face continued upward pressure in the first weeks of October as some shippers push to front-load export schedules ahead of the Golden Week holidays. Actual developments will hinge on the resilience of underlying demand and carriers' execution of capacity adjustment plans.
Stay tuned to Phaata International Logistics Marketplace for in-depth and fast market updates.
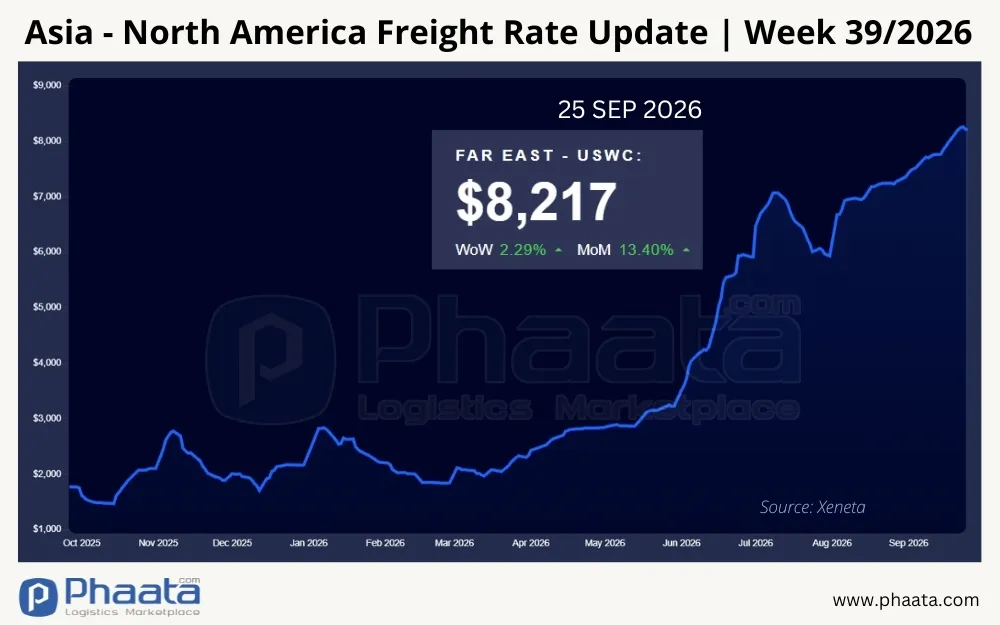
Asia-North America Freight Rates | Week 39/2026 (Photo: Phaata.com)
US Tariff Updates:
1. Russian Sanctions Act and Supplemental Tariff Mechanisms Enacted
Legislative Finalization: H.R. 5334, the “Lindsey O. Graham Sanctioning Russia and Iran Act of 2026,” was signed into law on September 18. The legislation establishes a mechanism to impose tariffs of up to 100% on certain imported goods from nations that fall under the law's purview, contingent upon conditions related to purchasing Russian oil/gas or facilitating sanctions evasion. The law also mandates tariffs of up to 500% on specific Russian-origin goods.
Upcoming Implementation: The enactment provides the legal foundation for these measures. The exact scope of commodities, targeted entities, and implementation timelines will depend on subsequent executive actions. Businesses with supply chains in affected regions should closely monitor impending enforcement guidelines and decisions.
2. Technical Adjustments to Pharmaceutical Tariffs, Effective Sept 29
New Codes for Clinical and R&D Goods: A U.S. Department of Commerce notice regarding adjustments to the pharmaceutical tariff schedule takes effect on September 29. The document introduces a new tariff code with a 0% duty rate for specific pharmaceutical products and related materials imported exclusively for clinical trials, research and development (R&D), or other non-commercial purposes.
HTSUS Code Updates and Synchronization: The document also amends various HTSUS codes and related provisions to update the commodity classification system, aligning with statistical standard changes effective since July.
3. U.S. Monitors Polysilicon Imports Ahead of Section 232 Implementation
Import Tracking: Ahead of anticipated adjustments to polysilicon and related products slated to take effect December 4, the U.S. Department of Commerce is actively monitoring import activities to identify instances where volumes significantly exceed historical baselines. The regulation also outlines criteria and enforcement mechanisms for new importers registering an Importer of Record (IOR) number from August 6, 2026, onward.
Weekly Volume Limits for New IORs: IORs registered since August 6, 2026, are subject to weekly volume caps for certain polysilicon-related HTSUS codes. Exceeding these limits without prior Commerce Department approval may result in import restrictions before December 4. CBP will notify affected IORs and customs brokers when restrictive measures are applied. Eligible businesses within this scope may file for exemptions under established procedures.
4. Section 301 Tariff Litigation
Ongoing Review of Legal Basis: Parties involved in the Section 301 tariff litigation continue to present arguments regarding the legal foundation of the investigation process and the imposition of the tariffs. The case remains under judicial review, with both sides continuing to articulate their positions on the scope and legality of the related measures.
Next Procedural Steps: While the case is under review, businesses with relevant import operations should stay updated on court rulings and agency guidelines to track potential changes affecting declaration procedures and import costs.
5. CBP Updates Section 301 Exemptions and Pilots EEM for Truck Exports
Section 301 Exemption Data Update: CBP has issued guidance regarding adjustments to Section 301 exemption codes for certain Chinese-origin products, aiming to synchronize with changes to 10-digit HTSUS statistical classification codes effective July 1, 2026.
Electronic Export Manifest (EEM) Pilot for Truck Exports: CBP announced a two-year pilot program for the Electronic Export Manifest (EEM) system for truck exports. Slated to begin on October 23, 2026, the voluntary program will accept a maximum of 9 qualifying carriers. Under the pilot, export manifest data must be transmitted electronically before the vehicle departs the U.S., supplemented by a complete manifest prior to arrival at the final export port.
-
Note: The EEM pilot for road transport unfolds as CBP continues expanding data digitization across transport modes. For rail transport, CBP has published the final EEM rule, which took effect October 26, 2026, with enforcement slated to begin October 26, 2027.
Stay tuned to articles on the Phaata International Logistics Marketplace for rapid and in-depth market updates.
3. Asia-Europe Ocean Freight Rates
Supply and Demand:
October Capacity Adjustments: Carriers will maintain approximately 100% of design capacity through the end of September. Moving into October, blank sailing programs are expected to intensify, with capacity cuts hitting roughly 20% in the week of October 12 and 17% the following week, before dropping to around 8% by late October. This recalibration is driven by China's Golden Week holiday and a weakening demand outlook. This dynamic primarily reflects carriers' strategy to balance supply and demand rather than a true space shortage spurred by surging bookings.
Schedule Reliability Plummets: Schedule reliability is currently a critical concern on the Far East - Europe corridor. On-time arrivals sank to approximately 6% in August, with average delays dragging out to 8.2 days—the lowest performance recorded since late 2021. Globally, on-time arrivals also dropped to roughly 29%.
Cascading Effects of Chinese Port Backlogs: The post-typhoon cargo backlogs at several Chinese port clusters may continue to disrupt cargo circulation in the coming weeks, potentially spilling over to exacerbate berth delays at European destination ports. Furthermore, services newly rerouted via the Suez Canal are still in their rollout phase and require more time to assess schedule stability.
Freight Rate Developments:
Ocean freight rates from Asia to Europe in Week 39/2026 decreased by 4.45% week-on-week, dropping to $3,780/FEU. This rate is down 19.69% month-on-month, according to Xeneta data.
Spot Rates Continue to Slide: The rate baseline on the Asia-Europe route sustains its downward trajectory. In the most recent week, spot rates on the Shanghai-Rotterdam leg fell by roughly 9%, while the Shanghai-Genoa leg dropped about 5%. This marks the 7th consecutive week of rate declines on the Asia-Europe route, standing in stark contrast to the upward trend on the Trans-Pacific.
GRI Slated for Mid-October: Amid a sliding rate baseline, carriers have announced plans to implement a General Rate Increase (GRI) effective October 19. The actual efficacy of these rate adjustments will hinge on demand developments, the depth of capacity cuts, and operational conditions on the route moving forward.
Stay tuned to Phaata International Logistics Marketplace for in-depth and fast market updates.
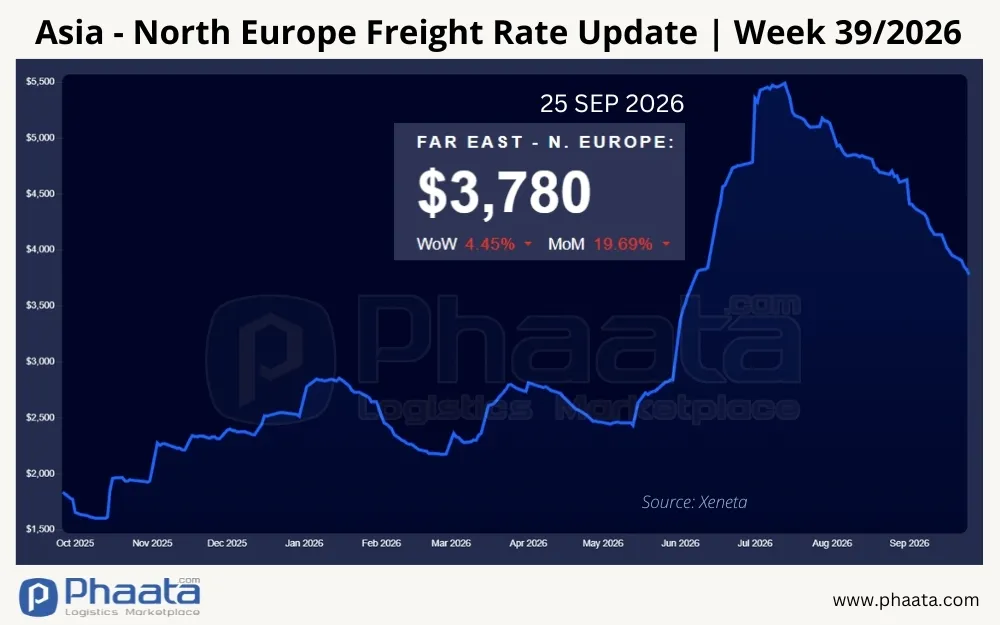
Asia-Europe Freight Rates | Week 39/2026 (Photo: Phaata.com)
4. North America - Asia Ocean Freight Rates
Ocean freight rates from North America (West Coast) to Asia in Week 39/2026 decreased slightly by 0.42% week-on-week, settling at $715/FEU. This rate is up 2.44% month-on-month, according to Xeneta data.
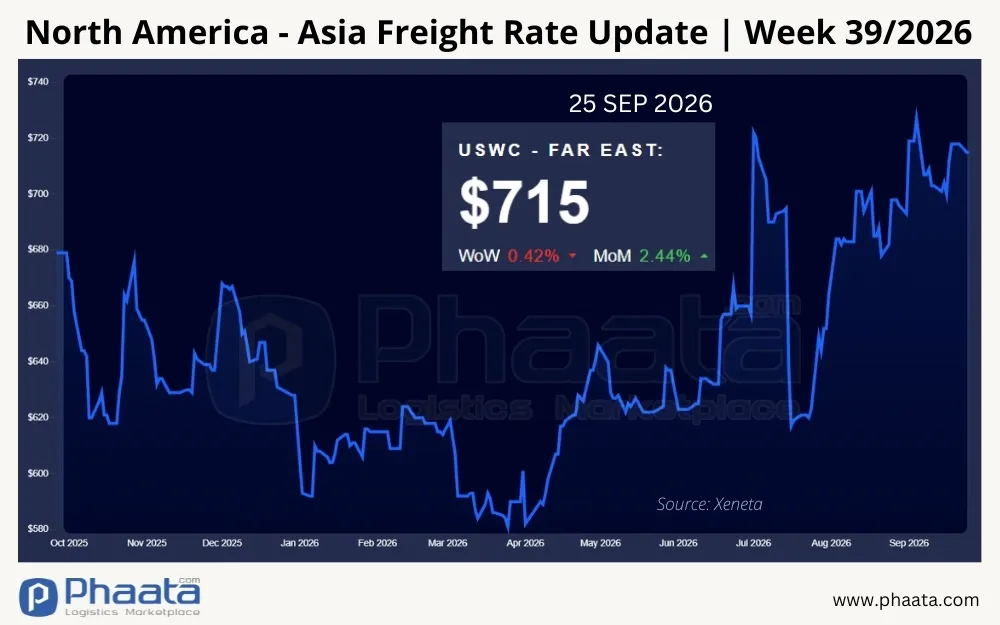
North America (West Coast) - Asia freight rates | Week 39/2026 (Photo: Phaata.com)
5. Northern Europe - Asia Ocean Freight Rates
Ocean freight rates from North Europe to Asia in Week 39/2026 decreased by 2.10% week-on-week, dropping to $233/FEU. This rate is down 14.65% month-on-month, per Xeneta data.
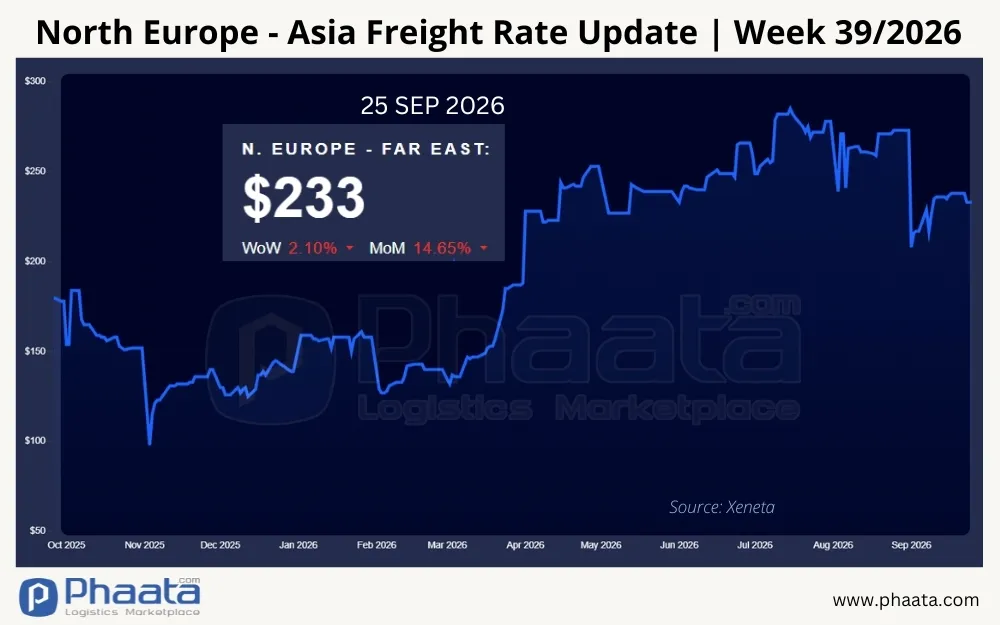
Container Freight rates from Northern Europe to Asia | Week 39/2026 (Photo: Phaata.com)
6. Conclusion and Recommendations from Phaata
The global logistics market concludes Q3/2026 highlighting stark divergences in supply-demand pressures and operational conditions across main trade arteries. The composite WCI dipped slightly by 0.71% to $4,468/FEU, while freight rates, capacity, and schedule reliability trajectories continue to polarize by corridor:
Trans-Pacific Route (Asia - North America): Operations remain heavily impacted at both origin and destination ports. In China, an estimated 1.1 million TEUs are backlogged at anchorages across Shanghai, Ningbo, and Yantian. The close succession of the Mid-Autumn Festival and Golden Week threatens to disrupt manufacturing and exports in the short term. In North America, September import volumes are projected to hit 2.31 million TEUs, while August rail dwell times at Los Angeles and Long Beach averaged 6.75 days. These factors are sustaining pressure on operational capacity and the West Coast spot rate baseline, which currently sits only about 18% below its pandemic-era peak.
Far East - West Europe Route: Schedule reliability continues to be a severe red flag. On-time arrivals plunged to roughly 6% in August with an average delay of 8.2 days—the lowest performance since late 2021. Meanwhile, spot rates continue to fall for the 7th consecutive week. Carriers plan to slash roughly 20% of capacity in October and have announced a GRI effective October 19 as supply and demand undergo further realignment.
U.S. Legal & Trade Compliance Landscape: H.R. 5334, concerning Russian sanctions, has been enacted, providing the legal framework to apply supplemental tariffs under conditions specified within the law. The exact tariff rates and scope will depend on upcoming implementation steps. Concurrently, new regulations managing polysilicon imports introduce weekly volume caps for certain newly registered IORs, elevating the need for import data monitoring among affected businesses ahead of the implementation of Section 232 measures.
Recommendations from Phaata
Monitor Space and Q4 Schedules:
Factor in Schedule Reliability: For Europe-bound shipments, beyond freight costs, businesses should consult historical schedule reliability data when selecting carriers and services. For highly time-sensitive cargo, adding a 7-10 day buffer to the ETA can provide crucial leeway to manage schedule volatility.
Track Blank Sailing Plans: Given that carriers expect to cut approximately 18-20% of capacity in early October, businesses should consider early booking for shipments with departure dates close to Golden Week.
Track North American Inland Connectivity:
Update Rail Dwell Times: Businesses utilizing IPI (Interior Point Intermodal) services must monitor rail dwell times at the LA/LB port complex to support robust delivery planning. If wait times trend longer, shippers should proactively negotiate free time (demurrage/detention) with transport partners and evaluate truck transloading options where viable.
Update Customs Regulations and Landed Cost Impacts:
Polysilicon and Solar Products: Businesses registering an IOR from August 6 onwards that fall under these regulations must track their weekly import volumes to proactively monitor usage against established caps. Should import requirements exceed limits, businesses should investigate DOC approval or procedural requirements in advance.
Update Pharmaceutical Exemption Codes: For pharmaceutical shipments or raw materials designated for clinical trials, businesses should review applicable HS and exemption codes effective September 29. This supports the preparation of compliant documentation under the new regulations.
Monitor the Scope of H.R. 5334: Businesses with supply chains tied to entities targeted by H.R. 5334 should continually audit the origin and components of their goods, while tracking implementation guidelines. As the scope becomes clearer, businesses can evaluate supply diversification strategies tailored to their operational needs.
Stay tuned to articles on Phaata.com or Phaata fanpage for rapid and in-depth market updates.
Find Freight Rates Here
Find Logistics Companies Here
See more:
- Hapag-Lloyd and FIMI Submit Revised Proposal for ZIM Acquisition
- US Shippers Expand Port-to-Inland Connectivity to Diversify Supply Chain Risks
- China’s Airfreight E-commerce Volumes Fall 16% in August
- SITC updates Vietnam-Intra Asia sailing schedules in Oct 2026
- Two More Oil Tankers Attacked in Strait of Hormuz as Risks Escalate
- Gemini shifts four services - AE5, AE11, AE12 and ME2 - to Suez routings
- SITC – CONNECTING CAMBODIA WITH VIETNAM AND THE WORLD
- COSCO Shipping Heavy Industry Begins A-Share Listing Process in Shanghai
- COSCO schedules: Vietnam - North America in Sep 2026
Source: Phaata - Where Shippers & Logistics Providers Connect
► Find Better Freight Rates & Logistics Service Providers!


Featured News
- Hapag-Lloyd applies Peak Season Surcharge from East Asia to USA and Canada
- The world\'s largest container ships MSC Irina and MSC Loreto floated
- MSC (Mediterranean Shipping Company) - The world\'s leading container shipping lines
- Information you need to know about Maersk Line
- Top 10 export and import goods between Vietnam - Philippines in the first 5 months of 2020

 Market News
See more
.webp)




_-_Copy.webp)

 HOT PROMO
See more
20
 FCL
FCL
 39 Days
 Freight cost

Savino Del Bene
34
FCL
35 Days
Freight cost

OPL LOGISTICS
844
FCL
2 Days
Freight cost

CÔNG TY TNHH PIO LOGISTICS
1751
FCL
31 Days
Freight cost

CÔNG TY TRÁCH NHIỆM HỮU HẠN DT LOGISTICS (VN)
2794
FCL
30 Days
Freight cost

CÔNG TY TNHH PEGASHIP
Why do thousands of businesses trust Phaata?
USERS/MONTH
LOGISTICS COMPANIES
REQUEST FOR QUOTEŚ
QUOTATIONS
VIETNAM LOGISTICS COMMUNITY
5 Steps to Get the Best Quote
Find a price quickly/Send a RFQ
Compare multiple options
Contact for Further Consultation
Negotiating prices/services
Management & rating
 Freight rates
Sea freight
- FCL
See more
33
16
Days Direct
- ₫58,218,600 / 20'GP

CHI NHÁNH THÀNH PHỒ HỒ CHÍ MINH - CÔNG TY TNHH HECNY SHIPPING VIỆT NAM
63
40
Days Direct
- ₫196,223,145 / 20'GP
- ₫229,301,895 / 40'GP
- ₫229,301,895 / 40'HQ

ALLIANCE INTERNATIONAL LOGISTICS CO., LTD
 Premium
275
Premium
275
 293
22
Days Direct
293
22
Days Direct
- ₫179,948,400 / 40'RQ

CÔNG TY CỔ PHẦN QUỐC TẾ ANVY
273
13
Days Direct
- ₫75,419,550 / 40'RQ

CÔNG TY TNHH VẬN CHUYỂN QUỐC TẾ RYLOGS
Sea freight
- LCL
See more
659
7
Days Direct
- ₫105,852 /cbm

Công ty Cổ phần vận tải xuyên đại dương OVC
3,255
4
Days Direct
- ₫26,463 /cbm

CÔNG TY TNHH IEC EXPRESS (VIỆT NAM)- CHI NHÁNH HÀ NỘI
4,314
5
Days Direct
- ₫26,463 /cbm

CHI NHÁNH TẠI THÀNH PHỐ HỒ CHÍ MINH - CÔNG TY CỔ PHẦN MG LOGISTICS
4,722
8
Days Direct
- Refund ₫2,362,500 /cbm

CÔNG TY CỔ PHẦN TIẾP VẬN INTERCARGO
4,926
4
Days Direct
- ₫26,463 /cbm

CÔNG TY CỔ PHẦN GIAO NHẬN VẬN TẢI MỸ Á (ASL LOGISTICS)
 Air freight
- General cargo
Air freight
- General cargo
See more
1,782
10
Days Transit
- 264,630 ₫/kg

Phoenix Logistics Vietnam - chi nhánh TP. Hồ Chí Minh (Phoenix International Forwarding Vietnam )
2,889
1
Days Direct
- 185,241 ₫/kg

CÔNG TY TNHH THƯƠNG MẠI VÀ DỊCH VỤ FASTRANS
6,221
 5,787
8
Days Transit
5,787
8
Days Transit
- 224,936 ₫/kg

CÔNG TY TNHH SEA GLOBAL VIỆT NAM
3,171
1
Days Direct
- 502,797 ₫/kg

CÔNG TY TNHH VẬN TẢI QUỐC TẾ GIA PHÚ
 Rail freight
- FCL
Rail freight
- FCL
See more
57
5
Days Direct
- ₫44,987,100 / 40'HQ
- ₫44,987,100 / 45'HQ

CÔNG TY TNHH PHƯỚC TÁ
357
3
Days Direct
- ₫15,083,910 / 40'HQ

CÔNG TY CỔ PHẦN VẬN TẢI VÀ THƯƠNG MẠI ĐƯỜNG SẮT
11,318
7
Days Direct
- ₫48,956,550 / 20'GP

Công ty TNHH T&M Forwarding
10,537
5
Days Direct
- ₫7,145,010 / 20'GP

ASIAN EXPRESS LINE VIETNAM ( AEL VIET NAM )
8,537
10
Days Direct
- ₫9,262,050 / 20'GP

CÔNG TY CỔ PHẦN LOGISTICS QUỐC TẾ V&T
 Road freight
- FCL
Road freight
- FCL
See more
61
1
Day
- ₫28,000,000 / 20'GP
- ₫28,000,000 / 40'GP

CÔNG TY TNHH THƯƠNG MẠI DỊCH VỤ VÀ KHO VẬN VIETTEL POST - TTC
99
4
Day
- ₫211,704 / 20'GP

CÔNG TY CỔ PHẦN KINH DOANH THƯƠNG MẠI VÀ DỊCH VỤ HỎA TỐC
43,375
1
Day
- ₫6,868,686 / 20'OT
- ₫6,868,686 / 40'OT
- ₫6,868,686 / 40'OT HQ

CÔNG TY TNHH LIÊN VẬN QUỐC TẾ SHINING OCEAN VIỆT NAM
101,127
2
Day
- ₫6,500,000 / 40'RF
- ₫6,500,000 / 40'RQ
- ₫6,500,000 / 45'RQ

CÔNG TY CP PROSHIP
Premium
171,162
1
Day
- ₫18,997,200 / 20'GP
- ₫18,997,200 / 40'GP

CÔNG TY CỔ PHẦN GIAO NHẬN VẬN TẢI CON ONG


